Analysis of VIPCCA integrated result in R
We implement downstream analysis based on the R language and some R packages (Seurat, KBET), including evaluating the degree of mixing and gene differential expression analysis.
Required packages
Several R packages need to be installed in the following analysis, including Seurat, SeuratDisk, kBET.
Read h5ad file with R
Import packages
library(Seurat)
library(SeuratDisk)
Convert h5ad files to h5seurat files After executing this code, a file in h5seurat format will be generated in the path where the h5ad file is located
Convert("/Users/zhongyuanke/data/vipcca/mixed_cell_lines_result/output_save.h5ad", dest = "h5seurat", overwrite = TRUE)
Read h5seurat file into a Seurat Object
mcl <- LoadH5Seurat("/Users/zhongyuanke/data/vipcca/mixed_cell_lines_result/output_save.h5seurat")
Calculating kBET
Preparing kBET data
celltype <- t(data.frame(mcl@meta.data[["celltype"]]))
vipcca_emb <- data.frame(mcl@reductions[["vipcca"]]@cell.embeddings)
batch <- mcl@meta.data[["X_batch"]]

# Split the batch ID and VIPCCA embedding result by cell type.
vipcca_emb <- split(vipcca_emb,celltype)
batch <- split(batch,celltype)
Calculating kBET for 293T celltype.
For detailed usage of kbet, please check the kBET tutorial .
library(kBET)

subset_size <- 0.25 #subsample to 25% of the data.
subset_id <- sample.int(n = length(t(batch[["293t"]])), size = floor(subset_size * length(t(batch[["293t"]]))), replace=FALSE)
batch.estimate_1 <- kBET(data_mix[["293t"]][subset_id,], batch[["293t"]][subset_id])

Differential gene analyses
We evaluate the results of integration by analyzing the differential expression genes between different batches. For more detail, see the documentation of FindMarkers() function.
First, we read the h5seurat file into a Seurat object.
mcl <- LoadH5Seurat("/Users/zhongyuanke/data/vipcca/mixed_cell_lines_result/output_save.h5seurat")
We use 293T cells from batches of ‘293t’ and ‘mixed as an example’.
library(Seurat)
Idents(mcl) <- 'celltype'
mcl$celltype.cond <- paste(Idents(mcl), mcl@meta.data[['X_batch']], sep = "_")
Idents(mcl) <- "celltype.cond"
br <- FindMarkers(mcl, ident.1 = '293t', ident.2 = 'mixed',
slot = "data",
logfc.threshold = 0.,
test.use = "wilcox",
verbose = FALSE,
min.cells.feature = 1,
min.cells.group = 1,
min.pct = 0.1)
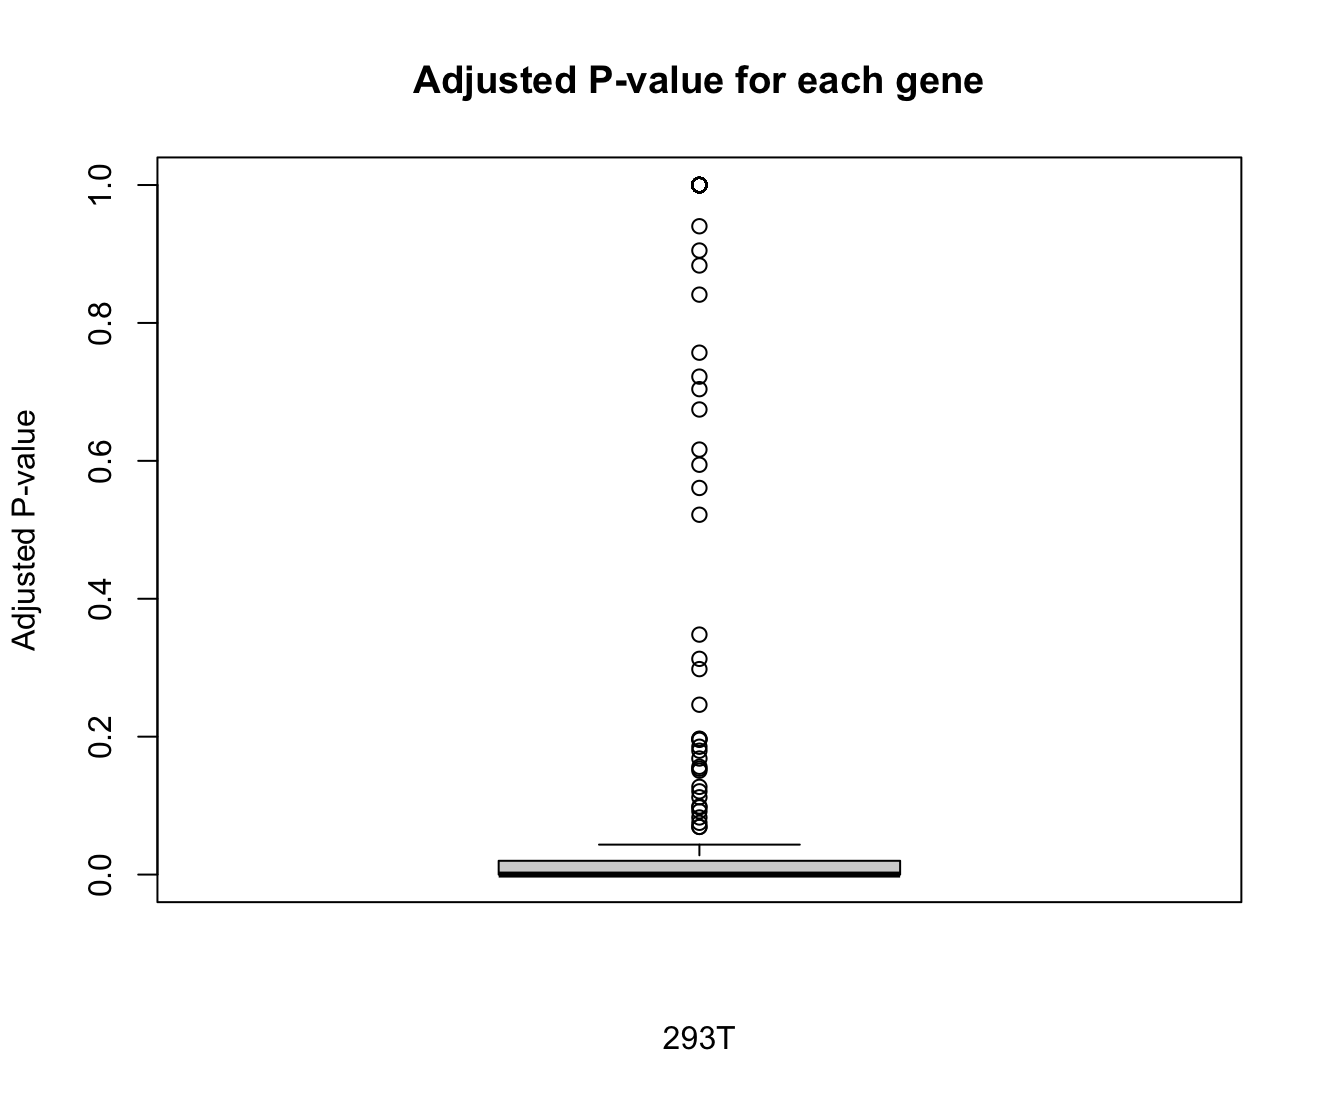
boxplot(br$p_val_adj,
main = "Adjusted P-value for each gene",
xlab = "293T",
ylab = "Adjusted P-value")
Plotting Enhanced Volcano
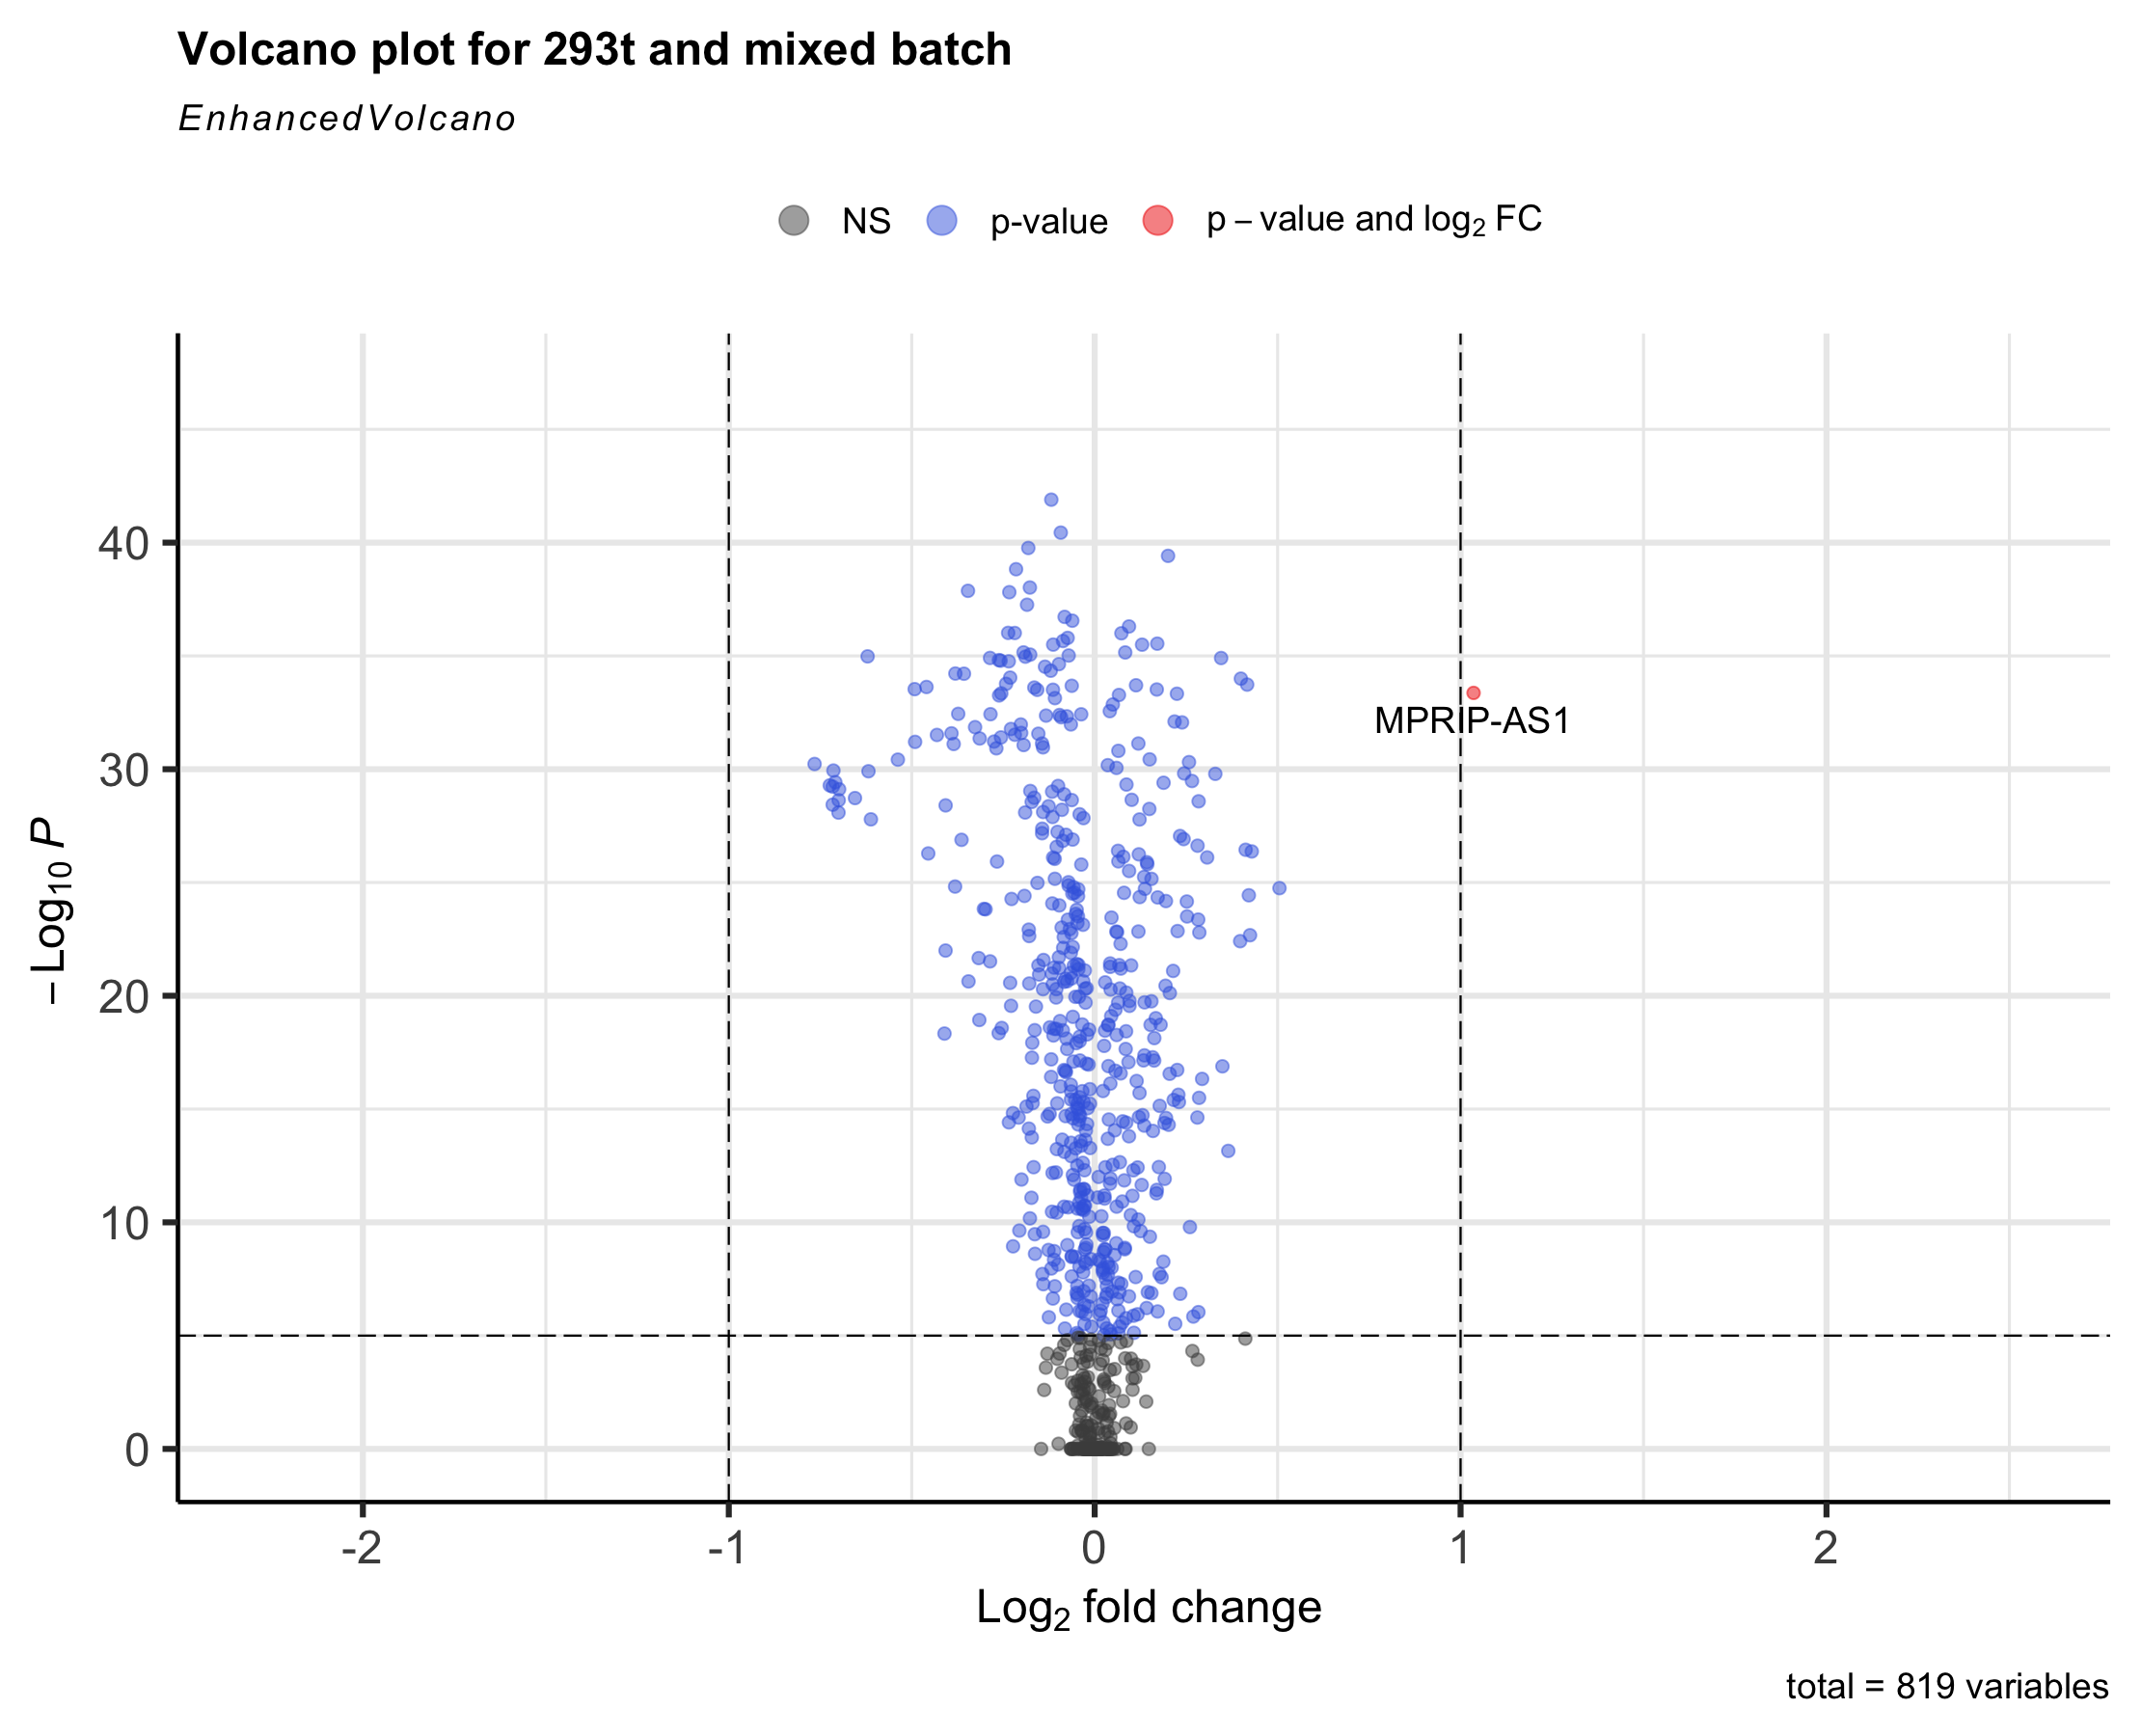
Volcano plots represent a useful way to visualise the results of differential expression analyses. The smaller the number of differentially expressed genes between two batches, the better the effect of batch effect removal. For more detail, see the documentation of EnhancedVolcano.
library(EnhancedVolcano)

EnhancedVolcano(br,
                lab = rownames(br),
                x = 'avg_log2FC',
                y = 'p_val_adj',
                title = 'Volcano plot for 293T',
                )